
Just as the Good Witch of the North needs her Munchkins and supervilllain Gru can’t work without his Minions, we at eguana sometimes need a little help from our friends, namely our widgets. They support and beautify eguana SCALES. Find out all about what widgets actually are and what our special widgets can do in this blog post.
Just like cookies, widgets are familiar to most people by name only: They know the words and can roughly put them in the drawer that also contains terms such as HTML and XY *. If you consult Wikipedia, a widget is a ” software application or component made for one or more different software platforms”. The term itself is made up of the two words “window” and “gadget” (freely translated a technical gimmick – we remember Inspector Gadget from the television series of the same name). The widget literally opens windows into deeper data structures through simple entries – that is, they only work as part of a system or an app, and not as independent structures. They have a visually appealing appearance and can mostly be found in overviews or (as with us) on dashboards.
It has always been our goal to develop a dashboard (which is a kind of display board) with useful widgets and important key figures. To do this, we first needed a corresponding database on which we could base the performance indicators and thus the meaningfulness of the widgets.
Window to the soul of the construction site
Our project manager Michael Ouschan remembers: “We started with the dashboard in 2018. At that time there was essentially a single widget: namely a link to process management in order to be able to display pie charts of different machines and compare their use. It wasn’t until 2019 that we really expanded the dashboard and invested a lot of time in internal development. On the one hand, new widgets have been added, on the other hand, new functions, for example the option to arrange the windows on the dashboard variably, or the option of clicking back in previous periods in some widgets in a timeline and thus being able to view the construction progress from start to finish. “
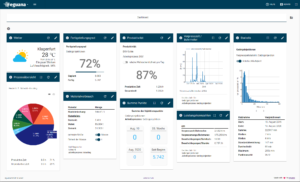
Ten such widgets are now available in the eguana SCALES dashboard, which each user can arrange as they see fit. For example, for keeping an overview of the machine use and its efficiency, for viewing trade-specific key performance indicators (KPIs) in real time, for keeping an overview of the withdrawal quantity for water retention, various statistics and forecasts including Monte Carlo simulation, productivity or degree of completion of the construction sites, or for keeping an overview to easily inform about the weather on the construction site.
The little guys are responsible for different things. The widget that is probably the easiest to explain is the weather display. It is useful for both everyday life and leisure, including daily construction reports. With our widget, the current weather conditions of the construction site, place of residence or the next holiday destination can be set very easily via GPS data and arranged directly next to the other construction site values.
Michael’s personal favorite is the “degree of completion” widget: It shows the percentage of the construction sites completion. User and project manager alike enjoy watching the number grow and seeing how many of the planned jobs have already been completed.
The performance overview of material consumption and current progress can also be seen at a glance through our widgets. Daily, weekly, monthly and total values, whether on departure, from the headquarters or directly in the construction container on the construction site: Browser on, SCALES in and dashboard bäm! It couldn’t be easier.
Sometimes more is more
It doesn’t stop with these widgets. “We now have a good foundation, but new widgets are constantly being added,” says Michael. And for them, in turn, the opportunity to present new performance indicators.
“So that we know in which direction our developments should go, we are particularly dependent on feedback from our partners and customers,” is Michael’s direct appeal to customers. We were able to derive many possibilities for future improvements, for example in the context of our “Lessons Learned” workshop. Because, as always, it counts to develop and offer things that are actually needed in the construction. And who is closer to construction than our customers themselves?
In order to be always up to date with regard to new widgets and their functions, our customers are informed directly by us by means of release notes in SCALES. When it comes to particularly cool features, we also like to call our customers or proudly show them off during training.
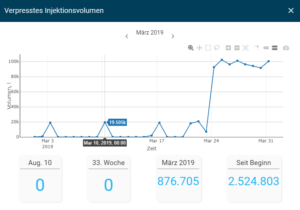
The current database is decisive for the widgets in the dashboard – the windows are therefore live. This can sometimes be forgotten in the heat of the moment. If the customer, the technical support and the developer all scratch their heads and don’t understand why the numbers have changed overnight … then you know it’s time for the weekend!
* Insert anything you want – the author doesn’t know it anyway